


本文來自格隆匯專欄:樊繼拓,作者:樊繼拓等
核心結論
我們以ROE為基礎,構建了兩類指標:偏離度(股價/ROE累計淨值)和PB/ROE,觀測估值的累計增長和近期水平,並分析股價與基本面的匹配程度。整體來看,金融板塊估值的累計增長和最新水平均在低位。最近一季,偏離度低的行業表現更好,行業指數在向ROE趨勢靠攏,風格也正向長期ROE趨勢迴歸。
從板塊偏離度指標來看,消費和成長板塊長期上偏,週期、穩定和金融板塊下偏。行業層面偏離度分化,上偏行業更多。社服、軍工和電子大幅上偏,石油、煤炭和銀行下偏幅度較大。
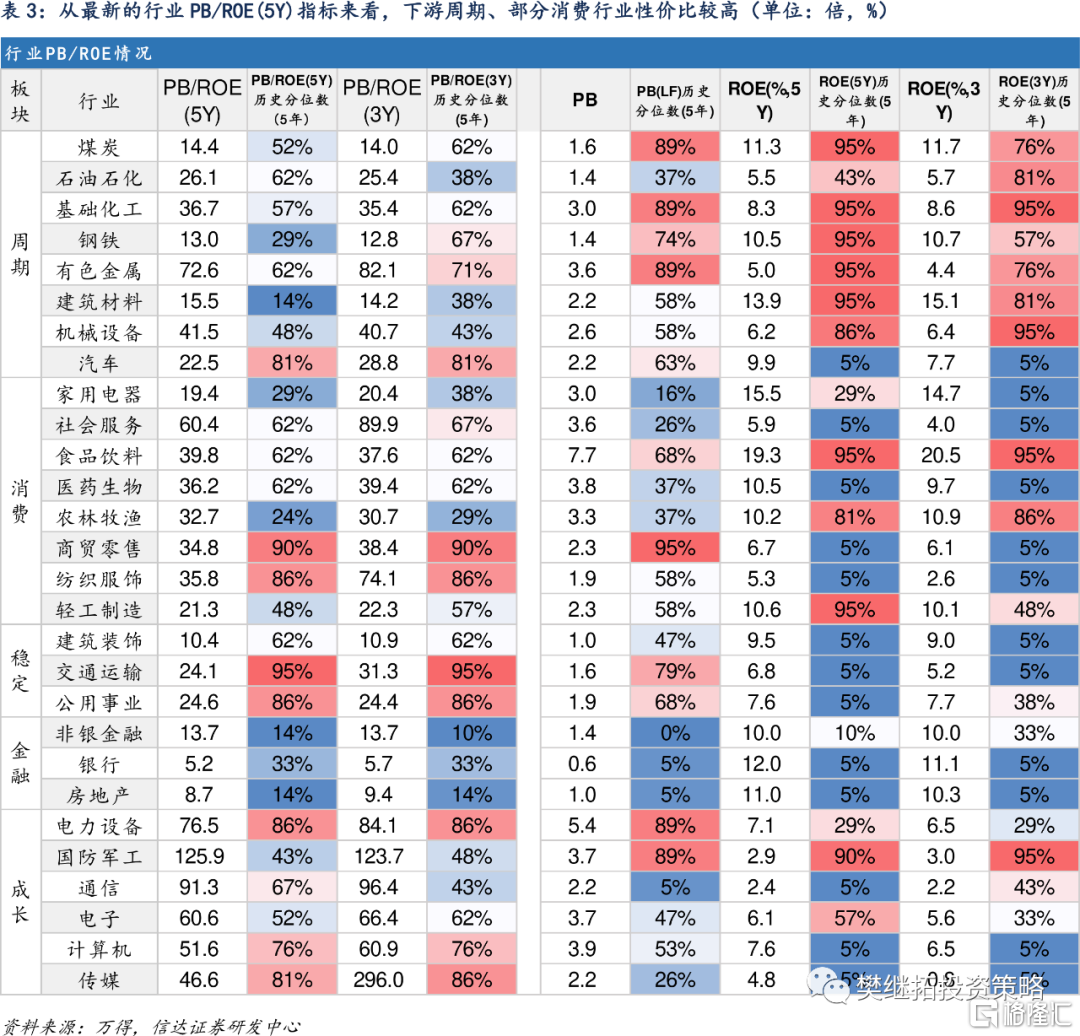
從PB/ROE指標來看,金融板塊偏低,穩定板塊指標偏低但分位較高。行業層面PB/ROE(5Y)指標中,下游週期(建材、機械)、部分消費(農林牧漁、輕工)和成長(電子)板塊行業,中長期景氣度高且市淨率較低。

正 文
1
從板塊偏離度來看,週期、金融和穩定板塊長期下偏
為了判斷當前行業指數相對於基本面的合理程度,我們構建並計算了偏離度指標。計算方法是=板塊或行業指數累計淨值/ROE累計淨值(2004/12/31至今)。ROE累計淨值=(1+ROE_t)的累乘。如果這一指標靠近100%,則表明指數增長與基本面的匹配程度較高,估值變化對指數的累計影響較小。
1.1 板塊間偏離度分化,週期、金融和穩定板塊下偏
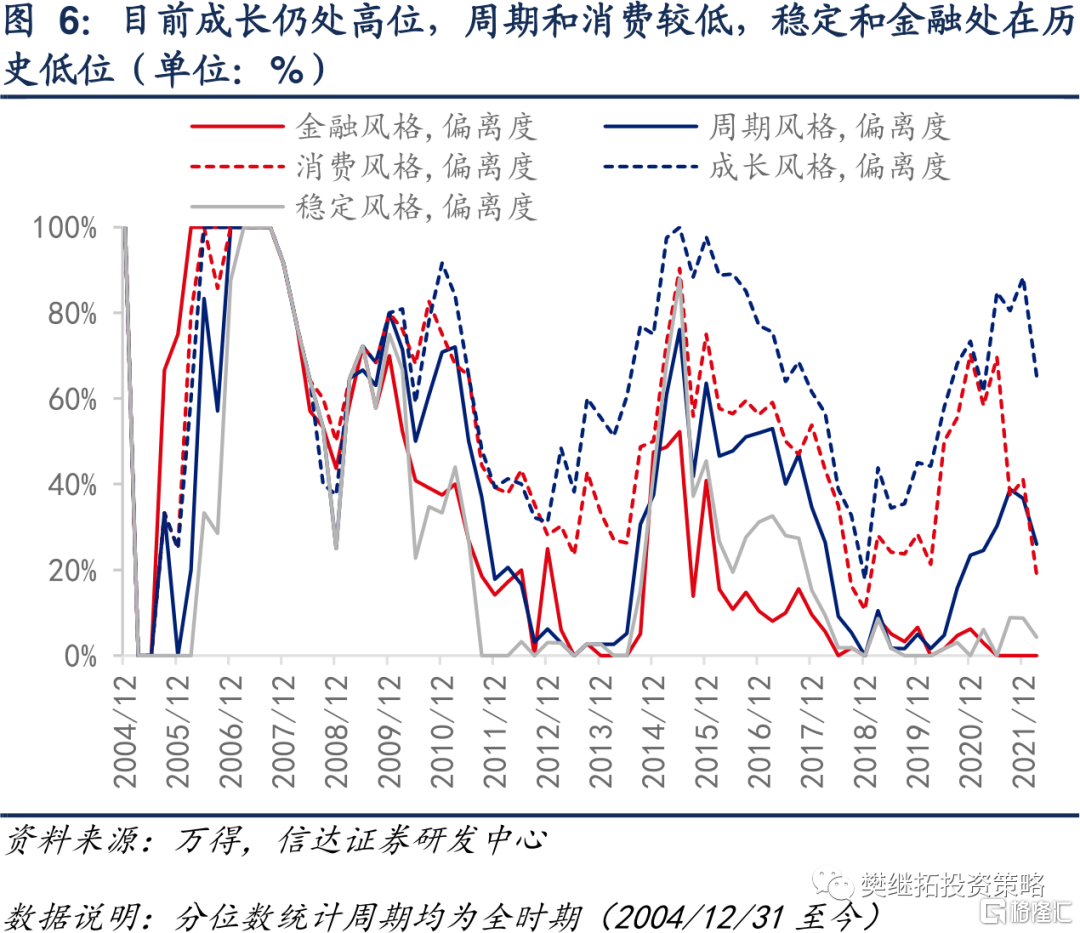
不同板塊的偏離度差異較大,消費和成長板塊長期上偏,週期、金融和穩定板塊下偏。從風格偏離度的分位數走勢來看,金融和穩定當前偏離度處在歷史低位。
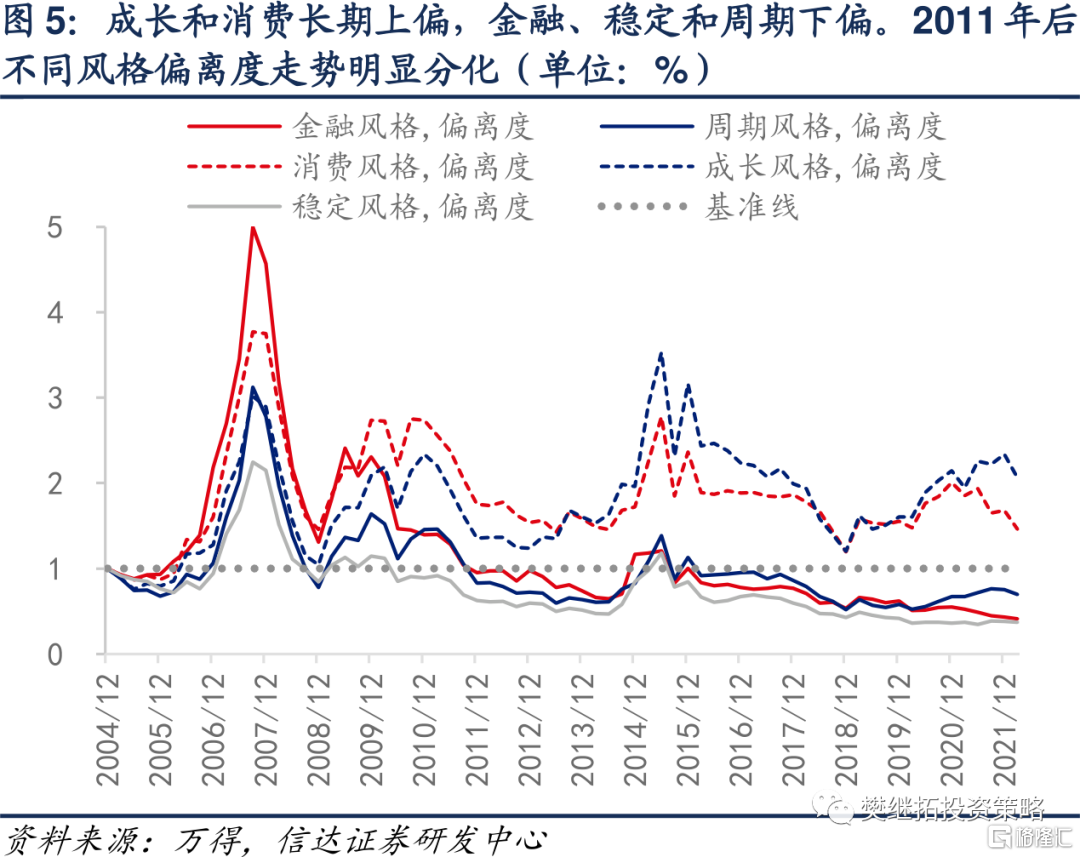
1.2 消費和成長板塊偏離度長期高於1,近1年來風格指數向ROE路徑靠攏
從板塊層面看,消費和成長指數偏離度均長期超過1。

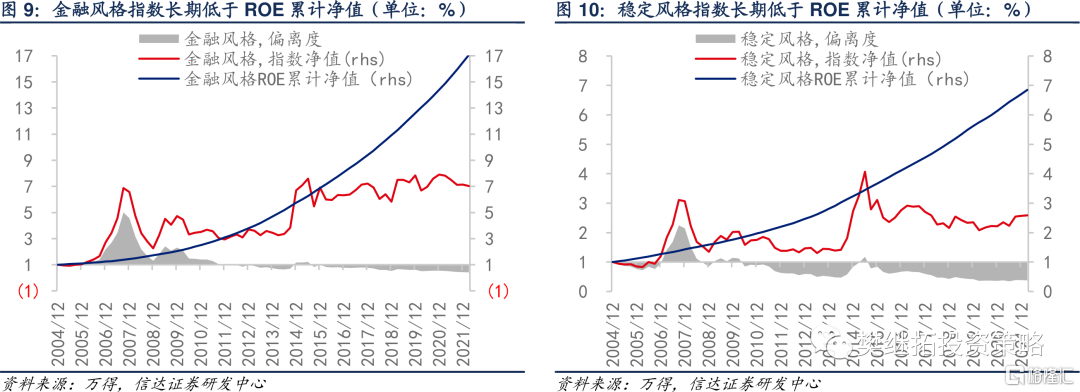
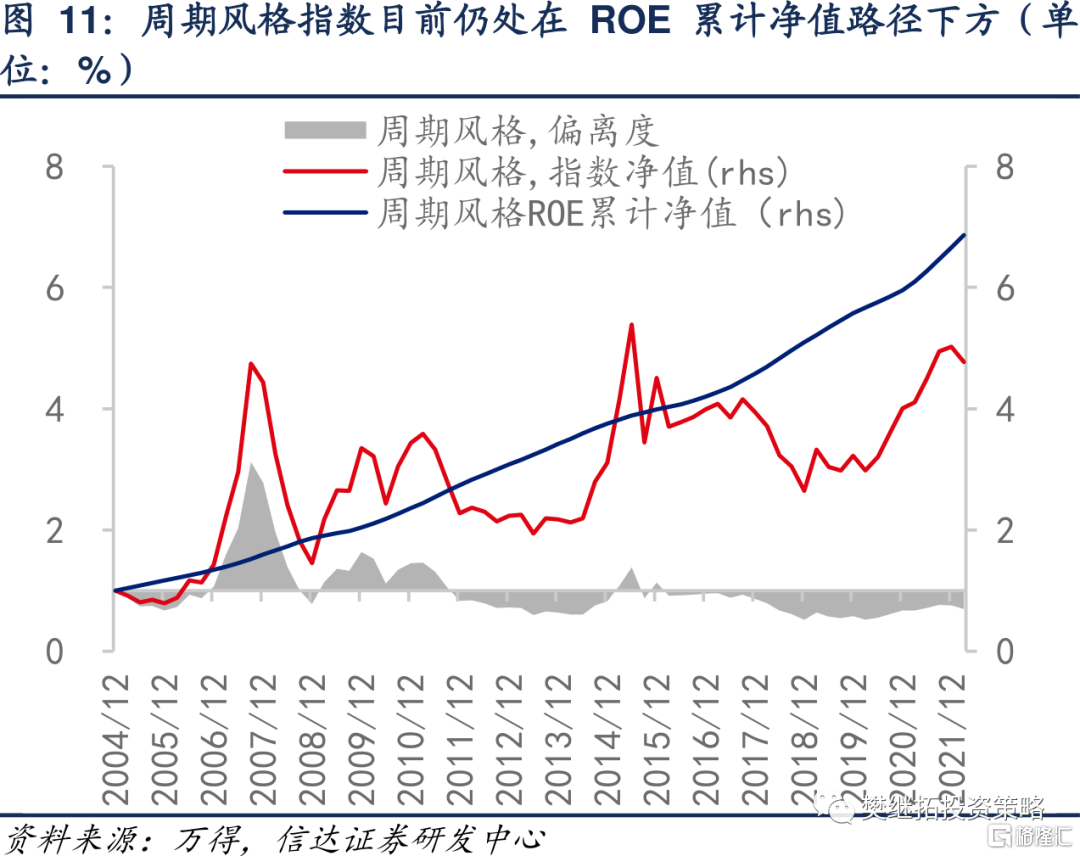
1.3 金融與穩定風格指數下偏幅度大,週期小幅下偏
金融與穩定板塊指數的ROE偏離度偏低,週期板塊指數淨值也略低於ROE。
2
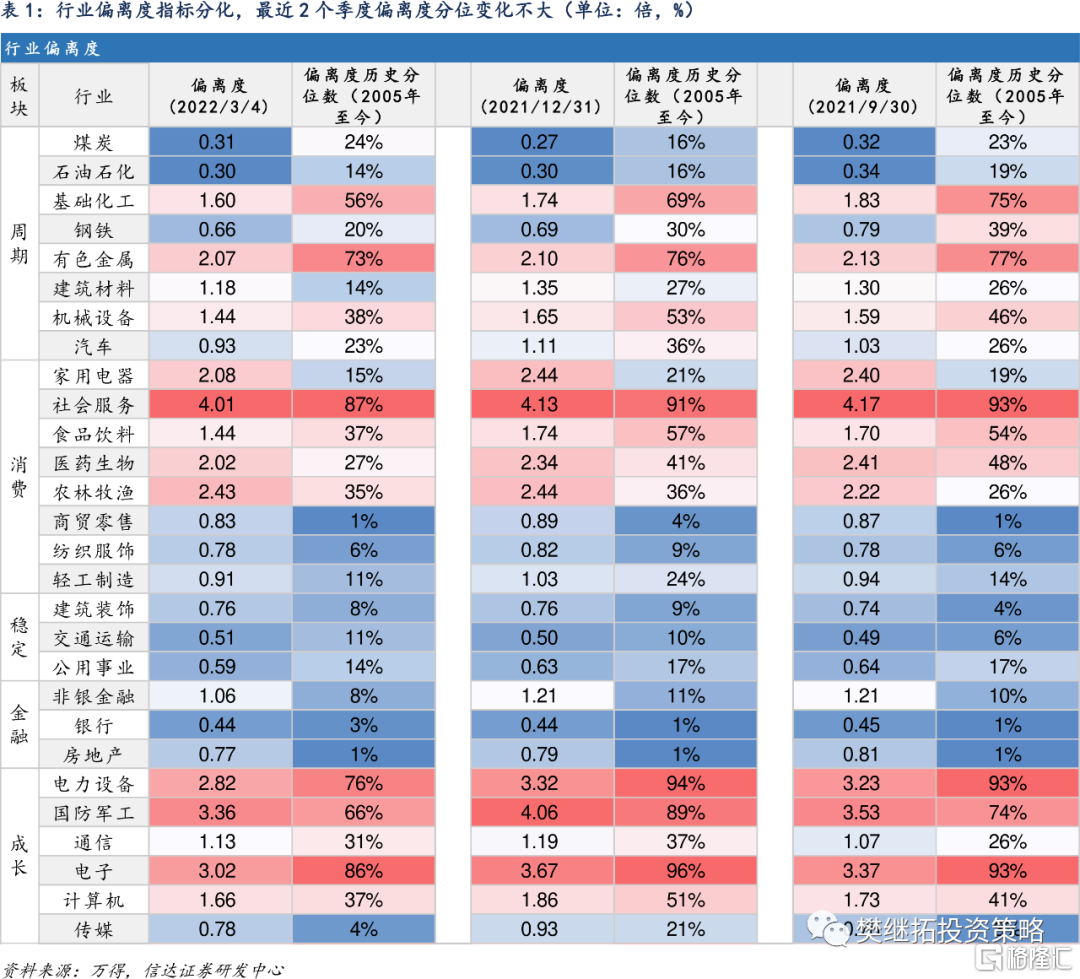
行業偏離度指標多數上偏,石油石化、煤炭和銀行下偏較多
2.1 從行業偏離度來看,石油石化、煤炭和銀行下偏幅度最大
從行業層面來看,偏離度大於1(上偏)行業更多,主要集中在成長、中游週期和大部分消費板塊。偏離度低於1的行業,主要集中在上游週期、金融地產、基建板塊和部分消費板塊。

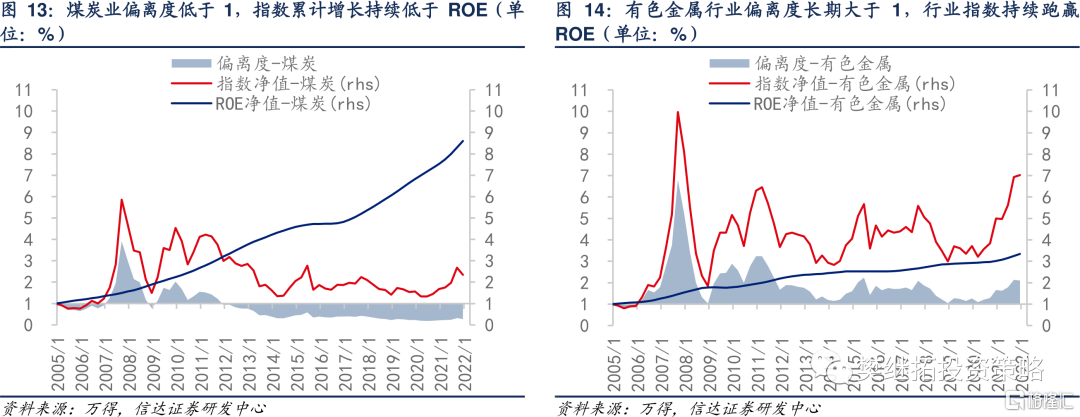
2.2 近期熱點行業中,煤炭偏離度長期低於1,有色金屬上偏
近期波動較大的行業中,煤炭偏離度長期偏低。有色金屬行業偏離度長期高於1,偏離度分位也在近期高位。
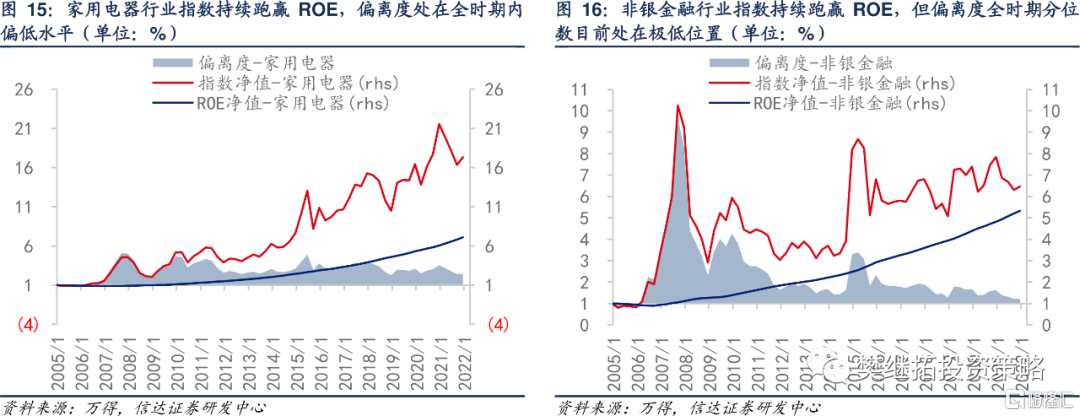
2.3 近期表現偏弱的行業中,家電與非銀偏離度較高
近期弱勢行業中,家用電器行業偏離度長期高於1,但偏離度分位數處於全時期內較低水平。非銀金融行業偏離度長期超過1,最新偏離度處在歷史低位。
3
從板塊PB/ROE指標來看,目前金融板塊處於低位
3.1 金融板塊PB/ROE(5Y)偏低,穩定板塊近期PB/ROE(5Y)分位數較高
我們構建另一個PB/ROE指標,計算方法是=PB(LF)/ROE(3年或5年均值)。從5年期PB/ROE指標來看,金融板塊明顯偏低,穩定板塊近期估值分位數較高。

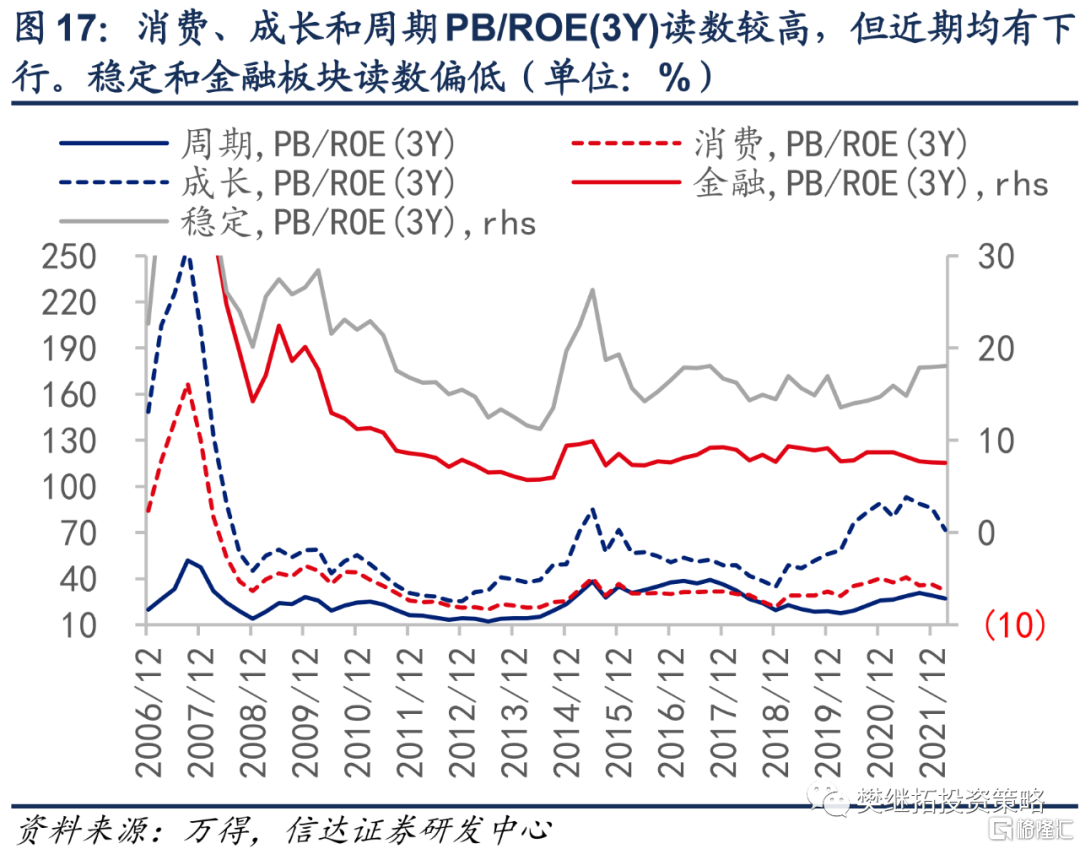
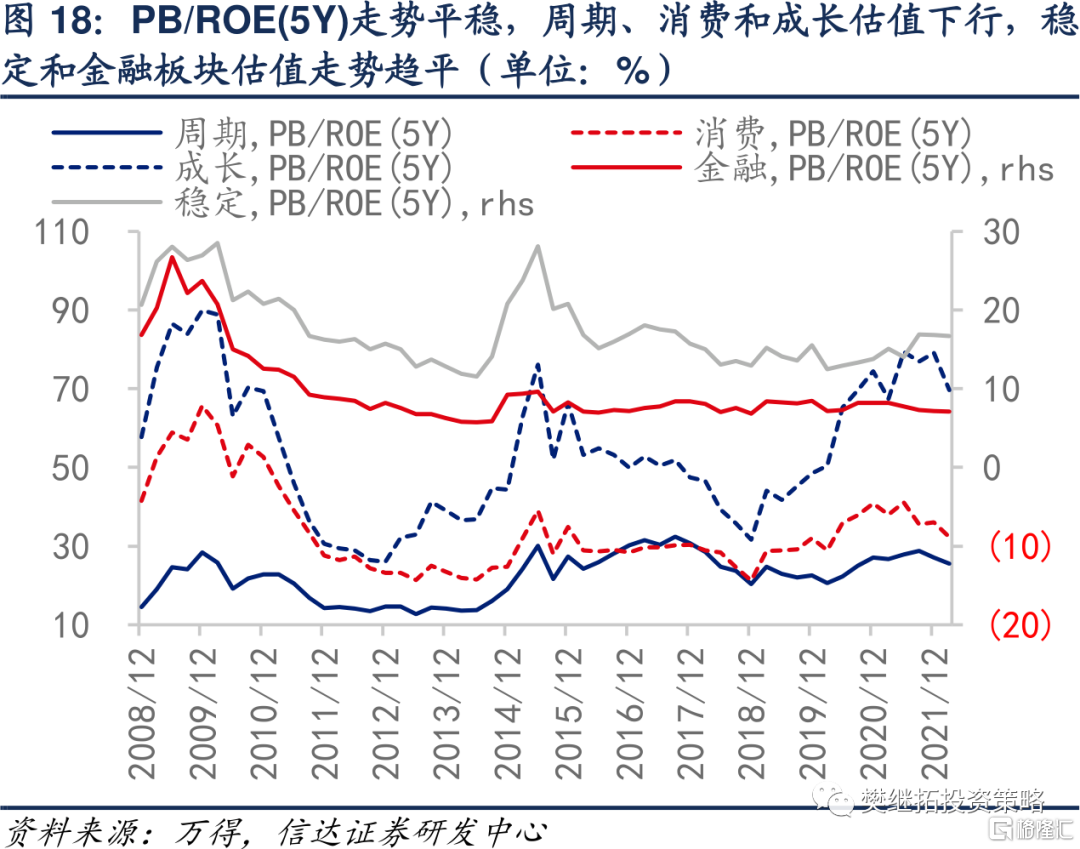
3.2 從歷史序列來看,成長和消費板塊估值長期領先
成長和消費板塊PB/ROE長期大於週期、穩定和金融板塊。從近期數據來看,消費、成長和週期估值下行。
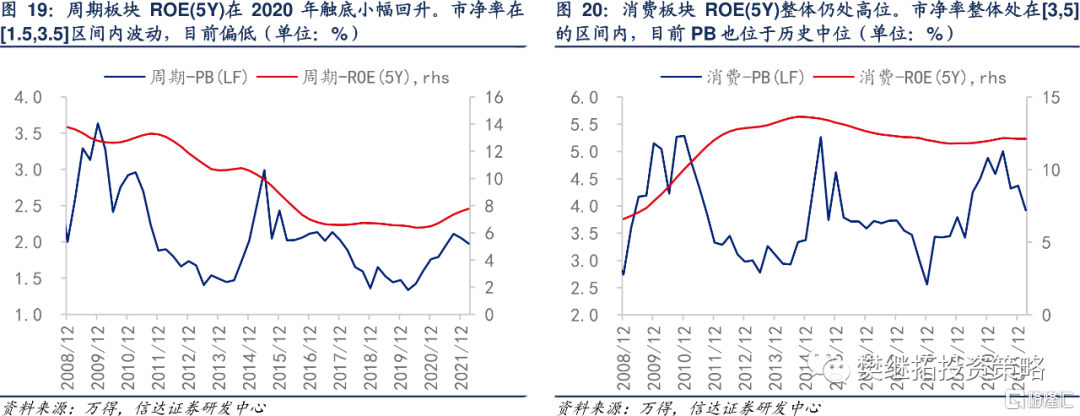
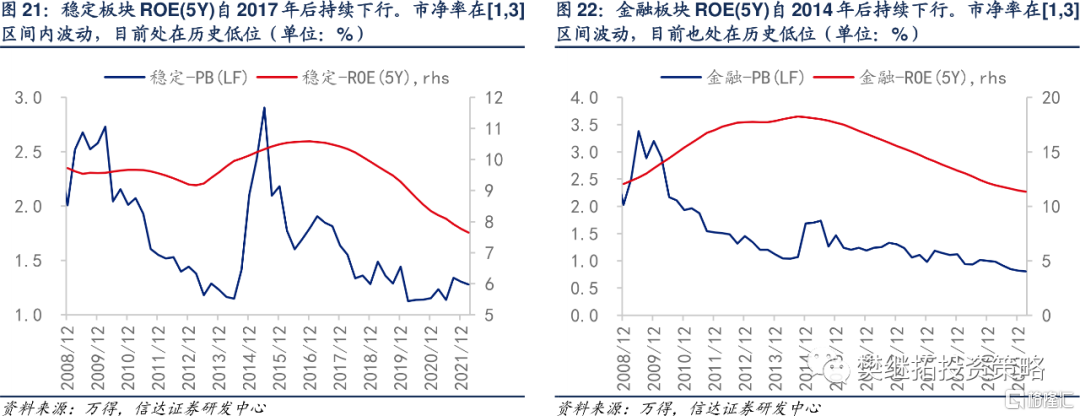
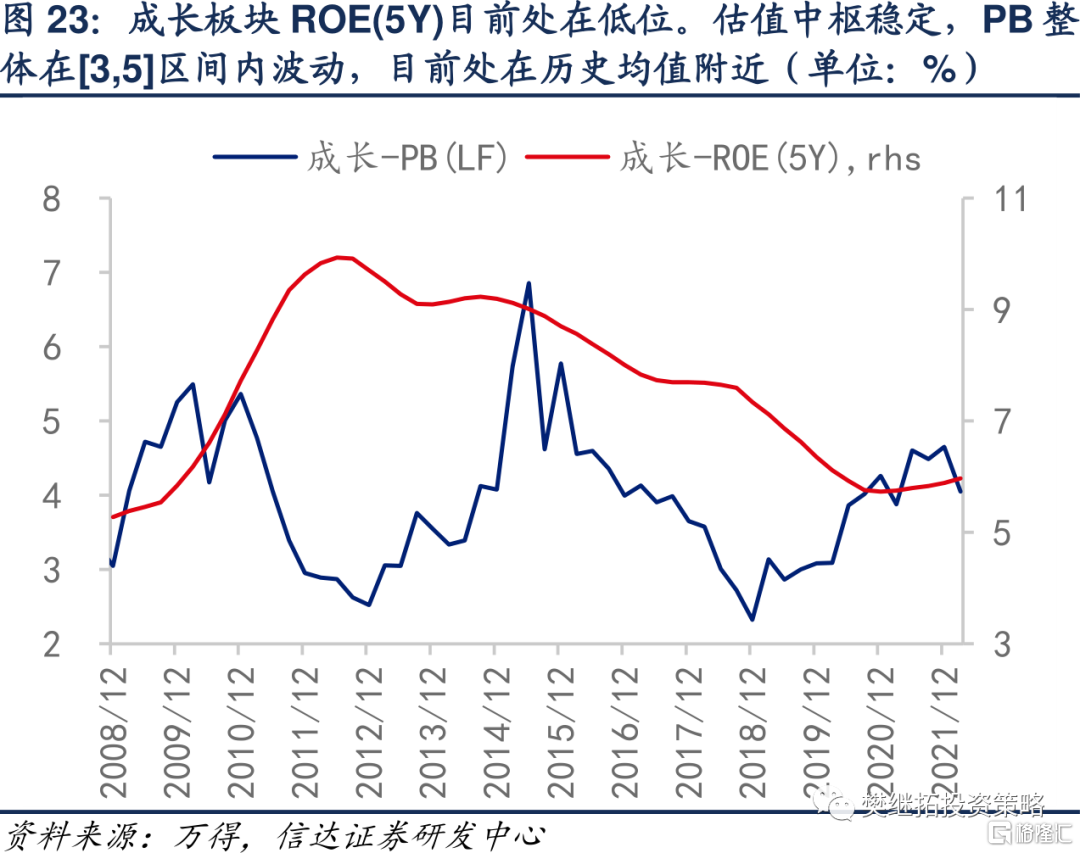
3.3 金融和穩定板塊ROE(5Y)趨勢下行,最新市淨率也處於歷史低位
板塊ROE長期ROE與市淨率通常比較匹配。消費長期景氣上行,估值在高位震盪。週期、金融和地產長期景氣下行,估值偏低。成長板塊ROE下行但市淨率持續偏高,或是因為其過去的ROE並不能代表未來。
4
行業層面PB/ROE指標中,下游週期、部分消費行業性價比高
4.1 部分下游週期板塊長期限景氣度較高,且市淨率分位較低
從行業層面來看,高景氣(ROE(5Y)5年內分位數>50%)行業中,建築材料、機械設備、農林牧漁、輕工製造和電子行業估值較低。
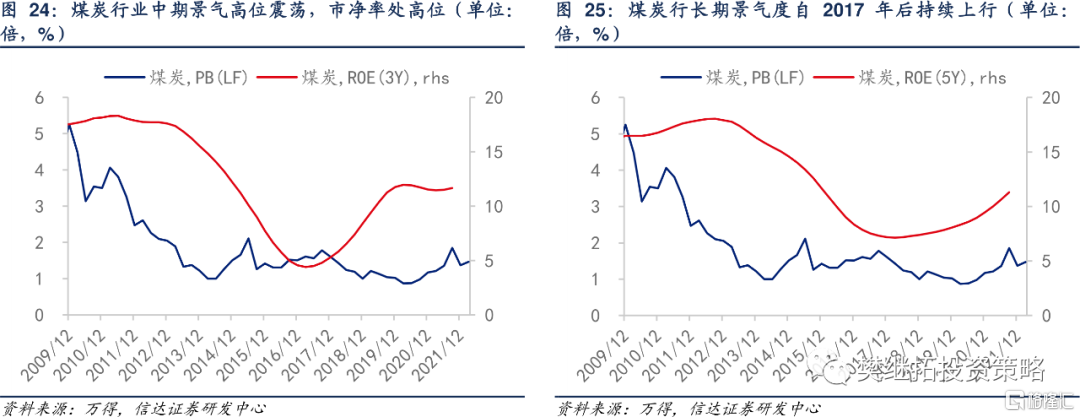
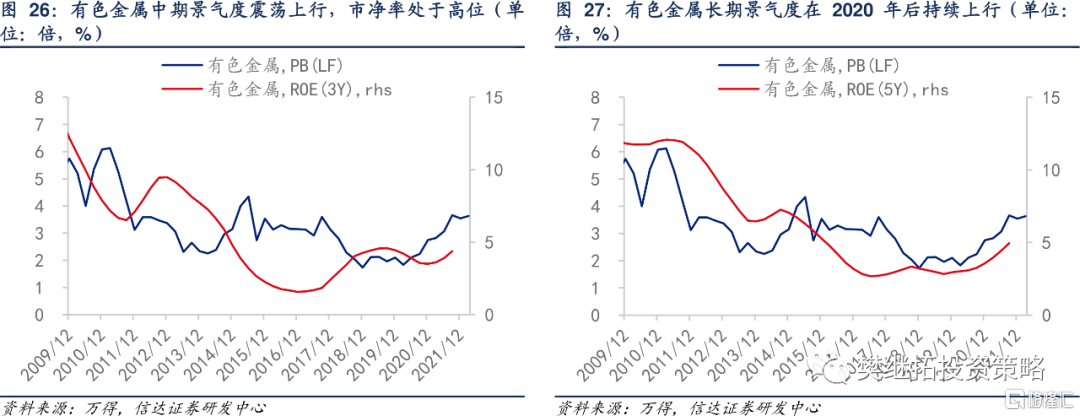
4.2 近期熱點行業中,煤炭和有色金屬行業中長期景氣度上行,市淨率處於高位
近期波動較大的行業中,煤炭行業中長期景氣度仍然較高。有色金屬行業景氣度從低位反彈,估值處在5年內高位。
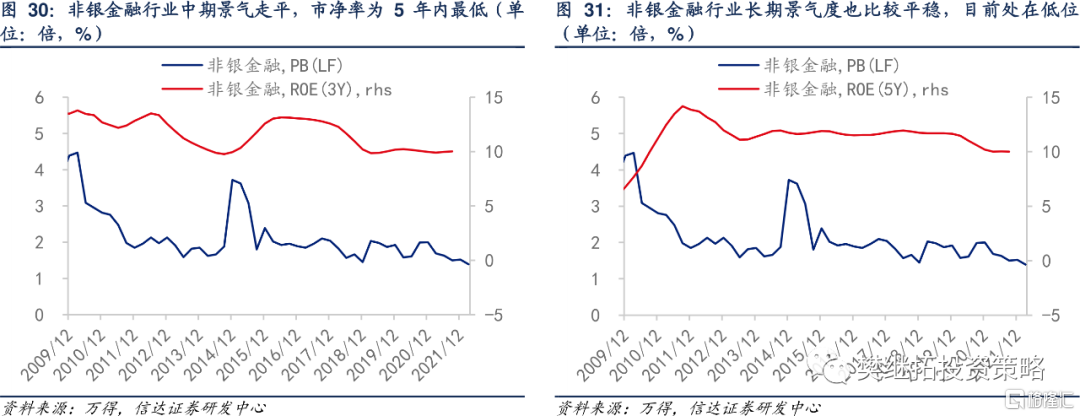
4.3 表現偏弱的行業中,家用電器和非銀金融行業市淨率都偏低
家用電器行業景氣度緩慢回落但仍在高位,市淨率處在5年內中等偏低水平。非銀金融行業景氣度回落後走勢平穩,市淨率處在5年內最低位置。

風險因素:基本面等指標公佈存在時滯,指標計算可能有偏差。


More Content

Physical Store(set to open in Q2 2025)
Address:
Shop LMC 307, 3/F, Lok Ma Chau MTR Station, Lok Ma Chau
Opening Hour:
9am - 9pm (Mon - Sat)
10am - 6pm (Sun and Public Holiday)

(set to open in Q2 2025)


