格隆匯ETF資金榜|4只滬深300ETF三日“吸金”超124億,超10億資金淨流出黃金ETF
週五A股全天縮量震盪,截至9月20日收盤,上證指數升0.03%,深證成指跌0.15%,創業板指跌0.64%,市場成交額5770億元,環比收窄逾500億。
本週五,香港恒生指數升1.36%,盤中創三個月來新高,恒生科技指數升1.43%,恒生國企指數升1.21%。美國三大股指收盤升跌不一,道指升0.09%,續創收盤歷史新高,標普500指數跌0.19%,納指跌0.36%。
9月20日,多隻滬深300ETF、中證500ETF、中證1000ETF成交額大幅放量。從成交金額來看,相關指數型基金合計成交額超360億元,較此前幾日大幅放量。滬深300ETF和上證50ETF累計成交額就已超250億元,大盤股指數基金仍是買入主力。
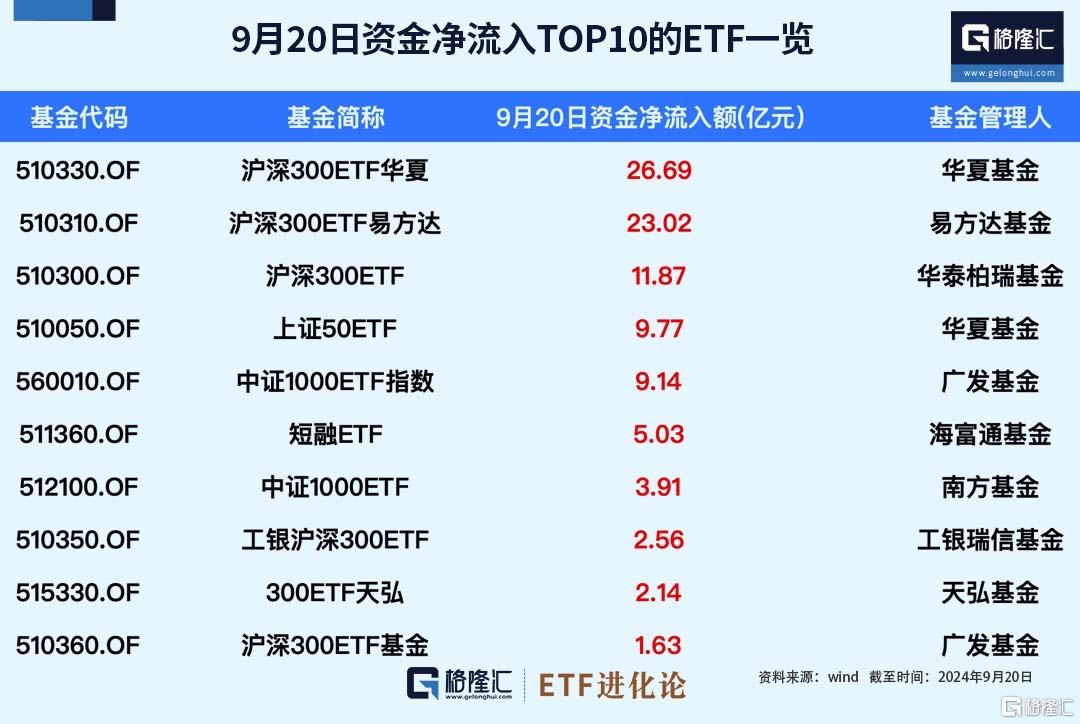
從ETF資金流向看,9月20日,資金淨流入額TOP10的ETF分別為滬深300ETF華夏、滬深300ETF易方達、華泰柏瑞基金滬深300ETF、華夏基金上證50ETF、廣發基金中證1000ETF指數、海富通基金短融ETF、南方基金中證1000ETF、工銀滬深300ETF、300ETF天弘、廣發基金滬深300ETF基金,在9月20日分別獲得26.69億元、23.02億元、11.87億元、9.77億元、9.14億元、5.03億元、3.91億元、2.56億元、2.14億元、1.63億元的資金淨流入。
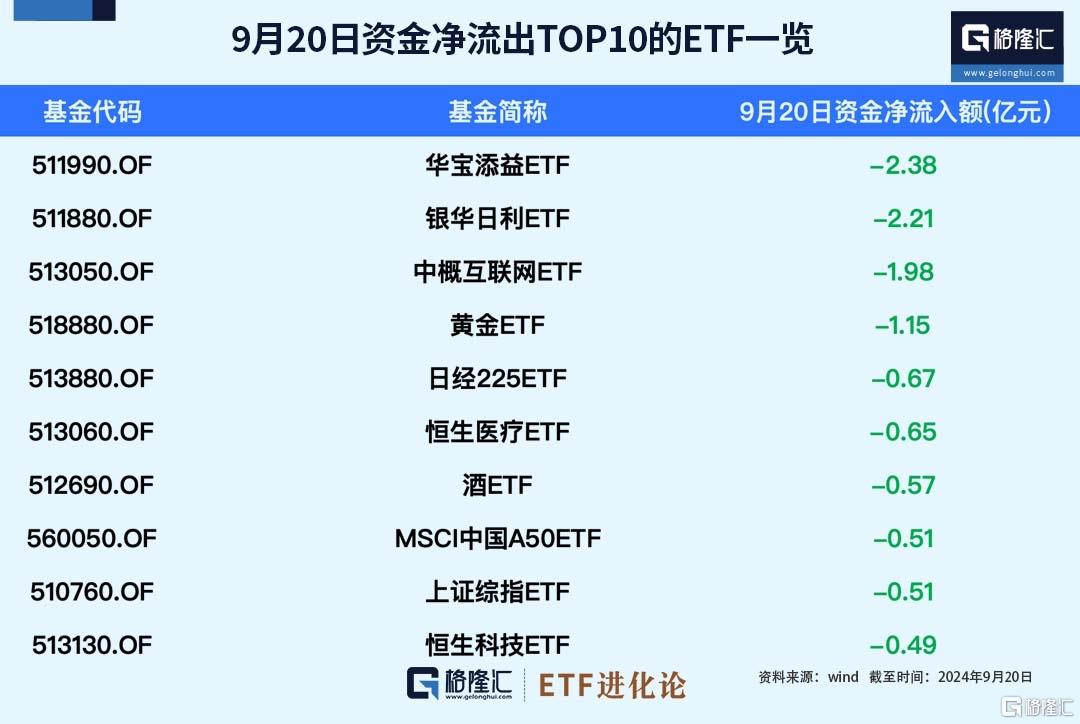
9月20日,ETF資金淨流出額TOP10的ETF分別為華寶添益ETF、銀華日利ETF、中概互聯網ETF、黃金ETF、日經225ETF、恒生醫療ETF、酒ETF、MSCI中國A50ETF、上證綜指ETF、恒生科技ETF,在9月20日分別獲得-2.38億元、-2.21億元、-1.98億元、-1.15億元、-0.67億元、-0.65億元、-0.57億元、-0.51億元、-0.51億元、-0.49億元的資金淨流入。
本週A股三個交易日,滬指累升1.21%,終結4連陰,深成指升1.15%,創業板指升0.09%。恒生指數本週累計上升5.12%,恒生科技指數週升6.44%,恒生國企指數週升5.11%。本週,道指升1.62%,標普500指數升1.36%,納指升1.49%。
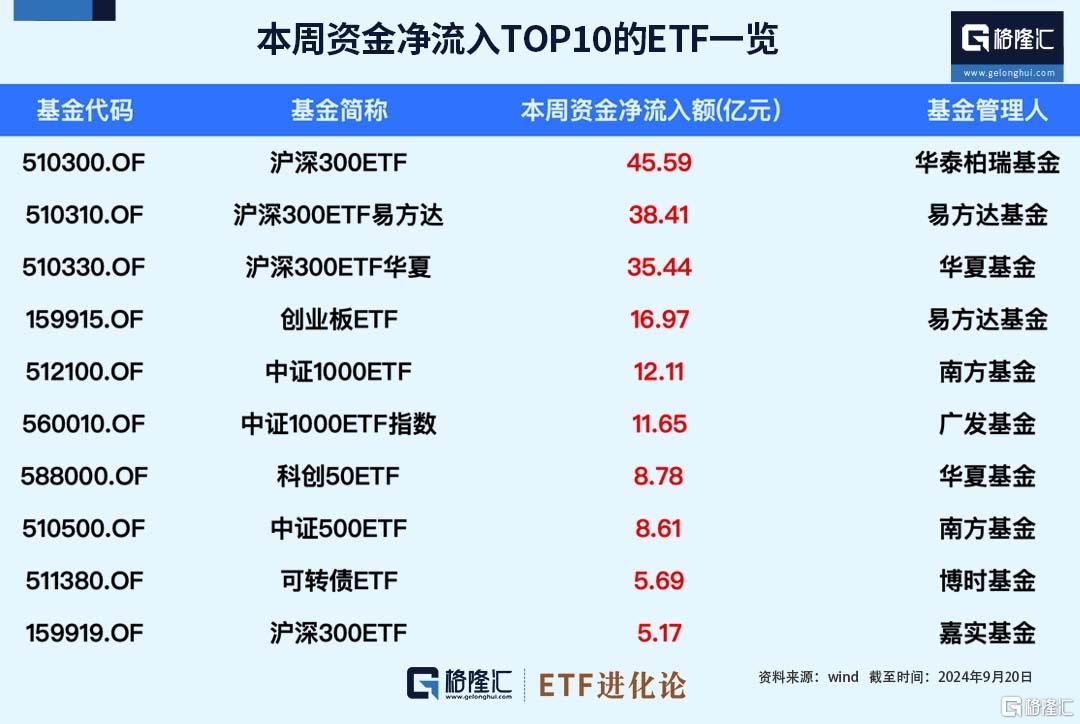
從本週ETF資金流向看,9月18日至9月20日的三個交易日,資金淨流入額TOP10的ETF分別為華泰柏瑞基金滬深300ETF、滬深300ETF易方達、滬深300ETF華夏、易方達基金創業板ETF、南方基金中證1000ETF、廣發基金中證1000ETF指數、華夏基金科創50ETF、南方基金中證500ETF、博時基金可轉債ETF、嘉實基金滬深300ETF,在本週分別獲得45.59億元、38.41億元、35.44億元、16.97億元、12.11億元、11.65億元、8.78億元、8.61億元、5.69億元、5.17億元的資金淨流入。
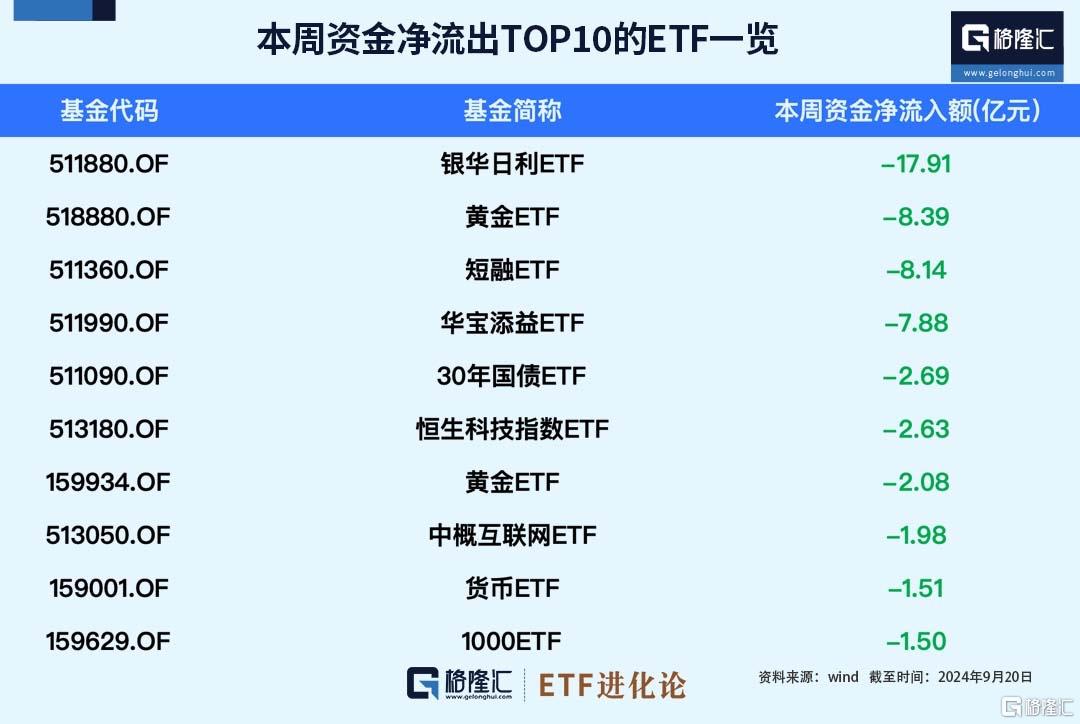
9月18日至9月20日的三個交易日,資金淨流出額TOP10的ETF分別為銀華日利ETF、黃金ETF、短融ETF、華寶添益ETF、30年國債ETF、恒生科技指數ETF、黃金ETF、中概互聯網ETF、貨幣ETF、1000ETF,在本週分別獲得-17.91億元、-8.39億元、-8.14億元、-7.88億元、-2.69億元、-2.63億元、-2.08億元、 -1.98億元、 -1.51億元、-1.50億元的資金淨流入。
下週是國慶假期最後一週交易時間,招商證券研報指出,A股國慶節前後市場表現通常呈現出一定的日曆效應。
國慶節後市場風險偏好改善,主要指數往往迎來反彈。從過去十年A股國慶節後一週表現來看,上證指數、滬深300、中證1000指數上升概率均超50%。從行業表現來看,國慶後五個交易日一級行業上升概率普遍在50%以上,其中上升概率靠前的行業集中在汽車、有色、紡織服飾、輕工製造、醫藥生物等行業,其中汽車和醫藥生物在國慶後兩週和國慶後一個月上升概率仍然較高。
估值方面,隨着盈利增速下移,整體A股估值中樞已經下移至歷史低位,大類行業中除金融、週期外其他行業估值大都處在歷史底部,細分行業中多數處於2010年以來的40%以下分位數,僅鋼鐵、汽車、房地產、煤炭、建築材料處於2010年以來40%以上分位。
Follow us
Find us on
Facebook,
Twitter ,
Instagram, and
YouTube or frequent updates on all things investing.Have a financial topic you would like to discuss? Head over to the
uSMART Community to share your thoughts and insights about the market! Click the picture below to download and explore uSMART app!

Disclaimers
uSmart Securities Limited (“uSmart”) is based on its internal research and public third party information in preparation of this article. Although uSmart uses its best endeavours to ensure the content of this article is accurate, uSmart does not guarantee the accuracy, timeliness or completeness of the information of this article and is not responsible for any views/opinions/comments in this article. Opinions, forecasts and estimations reflect uSmart’s assessment as of the date of this article and are subject to change. uSmart has no obligation to notify you or anyone of any such changes. You must make independent analysis and judgment on any matters involved in this article. uSmart and any directors, officers, employees or agents of uSmart will not be liable for any loss or damage suffered by any person in reliance on any representation or omission in the content of this article. The content of this article is for reference only. It does not constitute an offer, solicitation, recommendation, opinion or guarantee of any securities, financial products or instruments.The content of the article is for reference only and does not constitute any offer, solicitation, recommendation, opinion or guarantee of any securities, virtual assets, financial products or instruments. Regulatory authorities may restrict the trading of virtual asset-related ETFs to only investors who meet specified requirements.
Investment involves risks and the value and income from securities may rise or fall. Past performance is not indicative of future performance.