


5月7日,摩根士丹利表示,其他因素不足以動搖對中國股票的超配評級,MSCI中國的相對錶現將繼續好於其他新興市場;與美國存託憑證(ADR)相比,建議超配A股。同時指出中國經濟復甦態勢明確、主權償債能力更強,而且,線上經濟佔比較高,在保持社交距離的狀態下更有韌性。摩根士丹利維持基準預測下MSCI中國2020年盈利同比下滑2%、滬深300盈利持平的預測,遠好於新興市場13%的預計下滑幅度。
摩根士丹利作為一家全球領先的國際性金融服務公司,也是最早進入中國發展的國際投資銀行之一。近十年來對中國的經濟保持樂觀,而且在2017年就出具一份長期前景分析報告《為什麼我們看好中國》,提出中國很可能避免金融危機,並將在2027年達到高收入狀態。同時隨着對債務水平上升、改革步伐緩慢以及與美國潛在貿易衝擊等影響日益關注,中國正越來越多轉向高附加值製造業和服務業,人均國民收入將在未來十年從現在的8100美元提高到12900美元。
那麼在2020年摩根士丹利繼續看多中國,維持超配中國股票的評級的邏輯在哪?
國內疫情防控持續向好,經濟逐步恢復。國內的疫情爆發在春節之前,各個行業尤其是消費這塊錯過這個一年一度爆發的機會,再加上節後很懂企業沒法馬上覆工,經濟的休克療法幾乎在一整個季度,在4月份才有部分指數得到恢復。根據國家統計局數據,2月份中國製造業採購經理指數(PMI)為35.7,比1月下降14.3;非製造業PMI從1月的54.1下滑到29.6。
不過國家機器及時發佈各項經濟舉措刺激消費,維護好企業發展,在貨幣方面中國人民銀行利用可以支配的手段確保貨幣政策寬鬆,保證金融體系可以獲取充裕的流動性。同時國家税務總局2020年一季度新聞發佈會上表示,日前,今年首個季度申報納税期剛剛結束,税務部門及時完成了減税降費統計核算工作。據統計,今年一季度全國累計實現減税降費7428億元。
根據研究投資的第三方服務商巴德諮詢公司的中國問題研究團隊提出中國經濟繼一季度增速急劇下滑後,在二季度會初現V形復甦。
在全球大流行的背景之下,中國經濟是未來率先走影響發國家,反看美國仍處在流行當中,根據其公佈的數據,美國第一季度GDP總量為5.26萬億美元,根據下降4.8%來計算,美國第一季度GDP如果沒有增長的話,應該是5.53萬億美元。所以美國GDP下降的量約為0.27萬億美元,在未來,不排除二季度的GDP繼續受到影響。
外資進入受政策歡迎。中國股市逐漸具有一定的全球影響力,而作為全球股票市值較高的市場,加上A股加快國際化的步伐,外資進入門檻越來越低。在政策上面,自2020年4月1日起取消證券公司外資股比限制,符合條件的境外投資者可根據法律法規、證監會有關規定和相關服務指南的要求,依法提交設立證券公司或變更公司實際控制人的申請。
國內的外資開放程度越來越深,MSCI、富時羅素等國際指數逐步提升納入A股權重,尤其是MSCI指數將中國大盤A股納入因子從15%提升至20%,在MSCI中國指數和MSCI新興市場指數中的權重將分別提升為12.1%和4.1%。同時MSCI及富時羅素兩大指數公司都將在5月進行半年度指數審議。
所以政策上對於外資的流入持開放,歡迎的態度,根據招商證券統計如果以3月末北上資金持股在全部外資中佔比68%的比例進行估算,4月末全部外資持A股規模可能達到2.13萬億,佔A股自由流通股的8.56%。
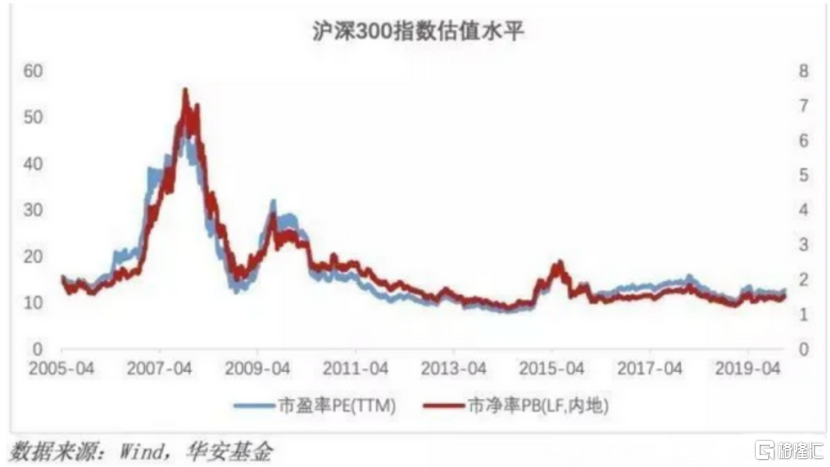
中國股票市場估值低。滬深300指數是外資眼中的“核心資產”,自陸股通開通以來,外資持續看好和增持。作為整個市場的代表,截至2019年12月31日,滬深300指數成分股數量僅佔全部A股數量的8%左右,但其總市值達超38.98萬億元,在全部A股總市值的佔比近60%,流通市值為13.30萬億元,佔比達到54%。
同時估值處於低位,目前滬深300指數的PE處於歷史上的33%分位點,PB處於歷史上的26%分位點,估值水平處於歷史低位。
開放歡迎的政策,率先從疫情走出來的國家經濟以及低估的上市企業。這三點是吸引外資持續買入中國優質企業的原因,摩根看多中國,顯然也是隨着潮流罷了。


More Content

Physical Store
Address:
Shop LMC 307, 3/F, Lok Ma Chau MTR Station, Lok Ma Chau
Opening Hour:
9am - 9pm (Mon - Sat)
10am - 6pm (Sun and Public Holiday)


