


作者:goblue
来源:产经快评
近日,国家国际局公布2019年3季度经济数据。2019年前三季度我国GDP累计同比增速6.2%,比上半年回落0.1个百分点,比上年同期回落0.5个百分点,一、二、三产业累计增速分别为2.9%、5.6%和7.0%;其中,3季度GDP同比增速6.0%,一、二、三产业增速分别为2.7%、5.2%和7.2%。6.0%的季度GDP增速是1993年以来107个季度的最低值,已经低于国际金融危机爆发后2009年第一季度6.4%的增速。而且从近期季度GDP增速来看,1993年以来增速最低的6个季度,除一个为2009年1月外,其它为2018年第三季度以来的连续五个季度:2018年三季度增速6.5%,四季度增速6.4%;2019年一季度增速6.4%,二季度增速6.2%,三季度增速6.0%。前三季度和第3季度GDP增速的下降显示我国经济增长仍面临巨大下行压力。

图1 1993年以来我国季度GDP增速(%)
表1 GDP同比增长速度(%)
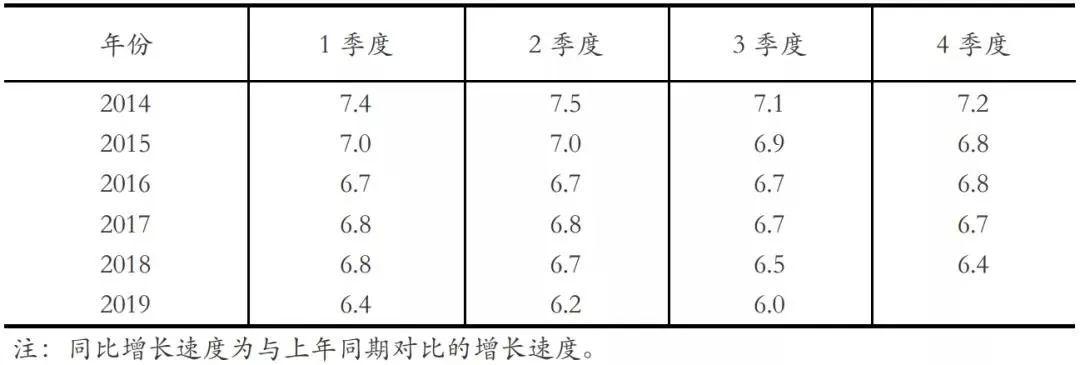
对于季度GDP增速下降到6%需要客观认识,既不能默然视之,也不能盲目恐慌。近期GDP增速的持续下降既有我国经济体C量不断增大、经济发展水平(以人均GDP衡量)不断提高的经济内在规律发挥作用,也受到严峻外部国际环境的影响。但无论与世界其他国家相比较,还是与发达国家的历史发展水平相比较,考虑到我国经济的巨大体量,6%仍然是一个相对较高的增速,我国经济增长仍处于中高速水平。
1
GDP增速的横向比较
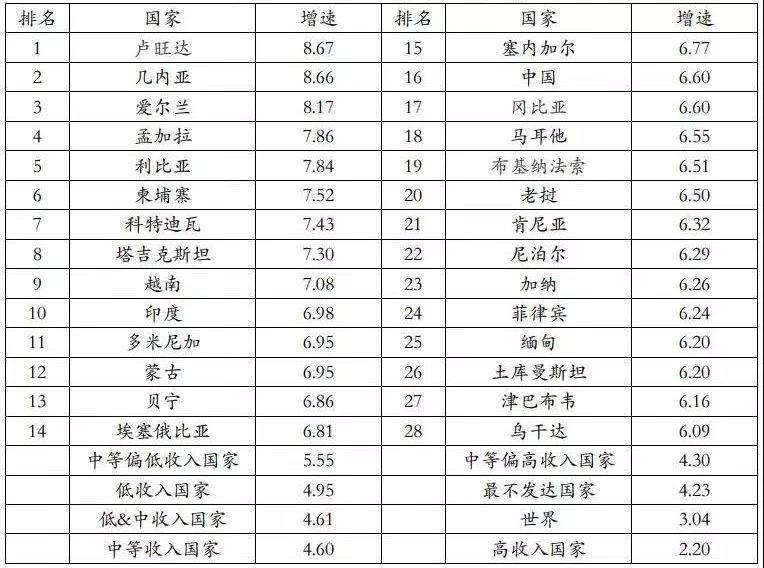
根据世界银行的数据,在公布2018年GDP增速的国家中,GDP增速超过中国(6.6%)的国家共有15个,GDP增速超过6%的国家共有26个。其中,卢旺达GDP增速最高,为8.67%;乌干达增速最低,为6.09%。2018年中国GDP增速为6.20%,人均GDP为9770.8美元(现价),属于中等偏高收入国家;而全球中等偏高收入国家的平均GDP增速为4.30,低于中国经济增速2.3个百分点。按中等偏低收入、低收入、低&中收入、中等收入、最不发达国家、高收入国家分组的平均GDP增速也均低于6%,只有中等偏低收入国家为5.55%,接近6%,高收入国家GDP增速更是只有2.20%。所以6%的GDP增速从全球来看属于较高水平。
表2 2018年GDP增速超过6%的国家
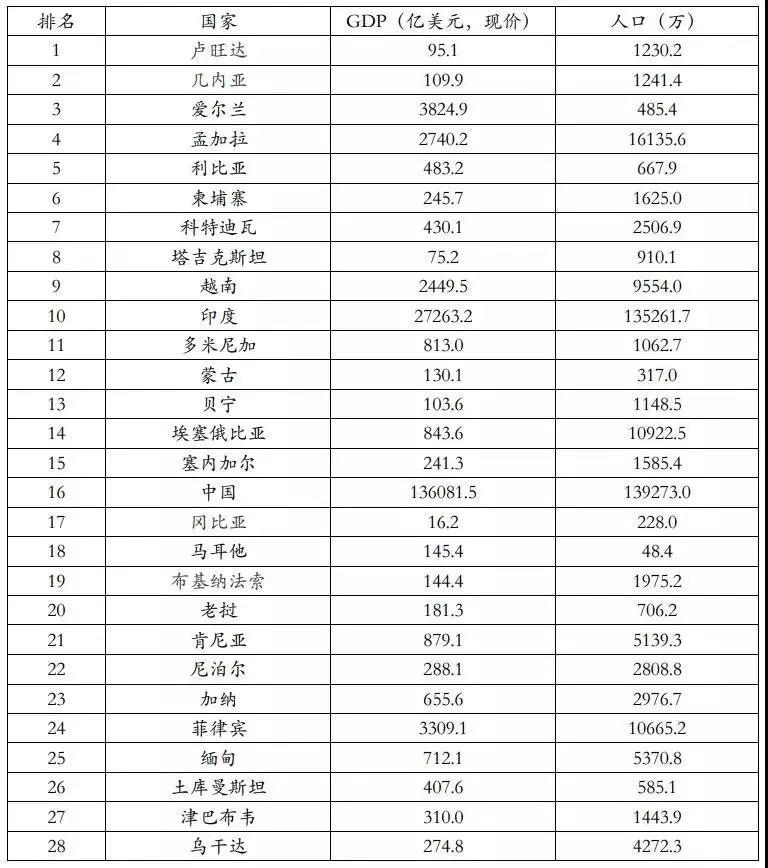
对比GDP增速前20位国家的GDP总量和人口规模可以发现,除印度经济体量和人口规模大以外,其他国家或者GDP总量很小,或者人口规模偏小,或两者兼而有之。例如,GDP增速最高的卢旺达GDP只有95.1亿美元,仅相当于中国的0.07%,人口1230.2万,不到中国的1%;孟加拉虽然人口规模超过一亿,但GDP规模只有2740.2亿美元,比中国低两个数量级,仅为中国的2.0%。虽然印度经济体量相对较大,但是GDP也仅相当于中国的20.0%。虽然2003年以来印度的GDP增速较高,但基本维持在7%左右波动,距中国高增长时期的GDP增速仍有很大差距。
表3 2018年GDP增速超过6%的国家的
GDP总量和人口
2
GDP增速的历史比较
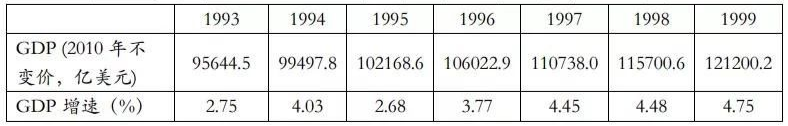
按照世界银行的数据,2018年中国GDP按2010年不变价美元衡量为10.8万亿美元。美国在1995年GDP规模达到10万亿美元(2010年不变价),在此前后,GDP最高为4.75%(1999年),不仅低于2018年中国经济6.6%的增速,也比2019年3季度历史阶段性最低记录低近1.3个百分点。
表4 美国在中国经济相当体量规模时的增速
(2010年不变价,10亿美元)
考察发达国家GDP增速达到或接近6%的时间及GDP规模可以发现(详见表5),1960年以来,美国GDP最高增速为1984年的7.2%,此时GDP为73359.4亿美元;此后GDP增速均低于6%。即使1960年以来(除1984年之外),也只有1962、1965、1966三年GDP增速超过6%,分别为6.1%、6.4%和6.5%,缺乏高速增长的持续性。日本距现在最近的GDP增速超过6%的年份是1988年,GDP增速6.78%,此时GDP为42764.5亿美元;德国距现在最近的GDP增速接近6%的年份是1991年,GDP增速5.1%,此时GDP为26998.46亿美元;英国距现在最近的GDP增速接近6%的年份是1988年,GDP增速5.8%,此时GDP为15819.74亿美元;法国距现在最近的GDP增速接近6%的年份是1989年,GDP增速4.3%,此时GDP为18402.5亿美元;韩国距现在最近的GDP增速超过6%的年份是2010年,GDP增速6.5%,此时GDP为10945.0亿美元。可见,这些主要发达国家GDP增速或接近6%时的GDP规模都远小于中国现在的水平。
表5 发达国家GDP增速超过6%的
时间及GDP规模
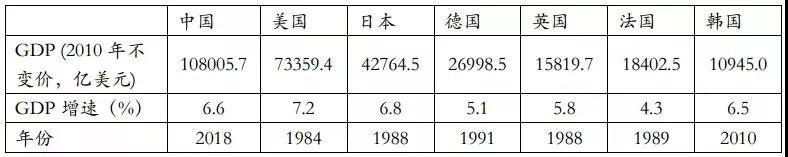
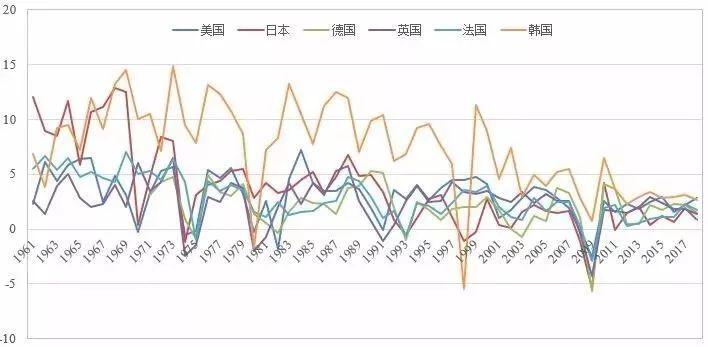
图2 1960年以来主要发达国家GDP增速变化
从图2可以看到,发达国家经济增长速度的走势呈现出随着经济规模扩大而不断下降的趋势,最后基本稳定在2%左右的水平。按照经济增长的一般规律,中国经济的增长速度也会随着经济发展水平提高、经济规模扩大持续下台阶。因此,没有必要对经济增速的下降过于担心,重点是守住不发生系统性风险的底线,不出现大规模的失业和系统性金融风险。在经济出现失速时,需要反周期的政策加以调节。另一方面,我们也要看到,我国经济仍有强劲的内生增长动力,随着改革开放的持续推进、新科技的成熟和扩散以及国际经贸环境的缓和,我国经济仍将能够在一个较长时期保持中高速增长。
说明:图1、表1数据来自国家统计局,其他图表数据来自世界银行。


More Content


