You are browsing the Hong Kong website, Regulated by Hong Kong SFC (CE number: BJA907). Investment is risky and you must be cautious when entering the market.
AMC发布2019Q2财报降支出是反弹的开始?
格隆汇 08-09 17:17

201988日盘前,美国最大院线AMC娱乐控股发布了截至630日第二季度的财务报告。根据财报,AMC第二季度实现营业收入15.06亿美元,同比增长4.4%;净利润4940万美元,同比增长122.5%;经调整EBITDA2.38亿美元,同比下滑2.9%。另外,由于从201911日开始,公司采用了新的会计准则——ASC 842,故采用同样方式调整后,2019Q2经调整EBITDA实际增长了7.3%

发布财报后,当天AMC股价大涨5.81%

2019年上半年,北美电影票房表现不太理想,上半年整体收入48.7亿美元,而去年同期为57.8亿美元。

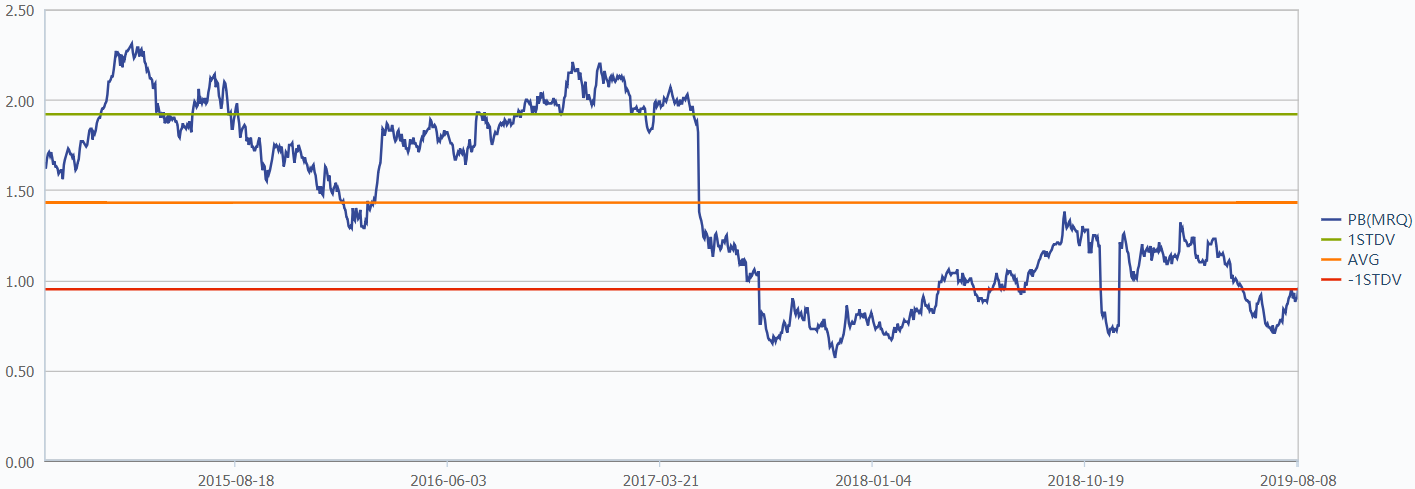
票房下滑直接反映在了院线的业绩上,Q1 AMC影院收入下滑了16%。再加上AMC已连续三个季度亏损,市场对该股票的整体情绪比较消极,股价在4月份到达高点后下跌至2018年来低点,彼时市净率仅0.7倍。

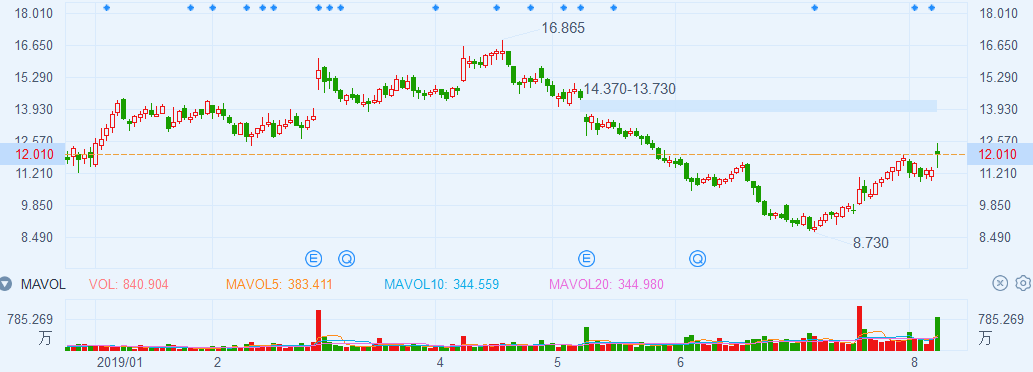
不过,其股价在之后迎来反弹,而此次发布的二季报则是对反弹逻辑加以佐证。

分业务看,19Q2 来自电影票的收入为8.95亿美元,同比基本持平,而二季度北美电影票房下滑了8.1%AMC电影票收入逆势稳健原因为:1)国际业务贡献,AMC 1/4的影院位于国外,二季度这些影院的观众人次上升了16.6%2)订阅服务A-list的引流作用,该订阅服务自去年6月推出以来,累计了超过90万的订阅用户,这些用户平均每个月观看2.85部电影,本土用户观影人次同比增长了3.1%3)现象级电影《复仇者联盟4》大卖。

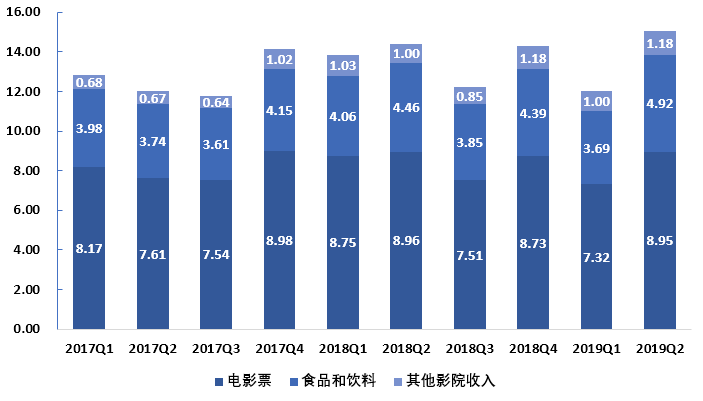
图:2017Q1~2019Q2 AMC分业务收入(亿美元)

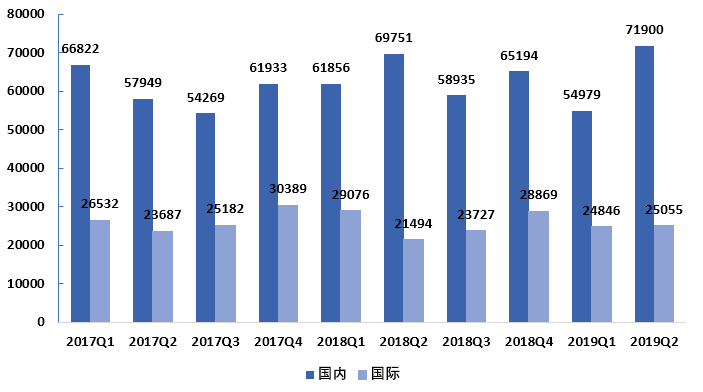
图:2017Q1~2019Q2 AMC 本土与国际观众观影数(千次)

也是同样的原因,2019Q2平均票价同比略有下跌,从去年同期的9.82美元下降为9.23美元。

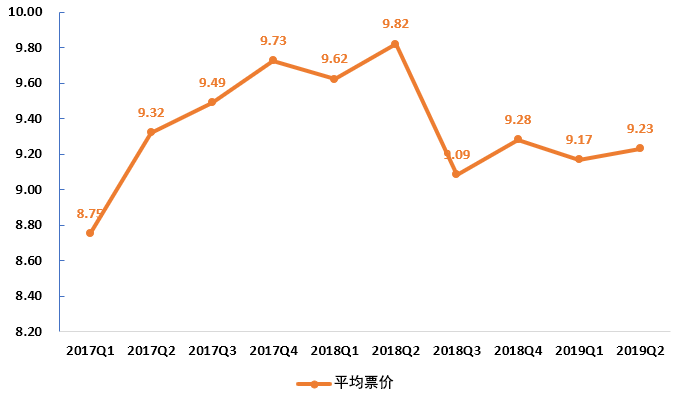
图:2017Q1~2019Q2 AMC平均票价(美元)

订阅服务A-list订阅费用为19.85美元,平均月消费频次为2.85次,根据平均票价计算,并不显著低于非订阅收入。并且其产生了明显引流,一方面带动了其他非订阅用户活跃度增加,另一方面带动了食品与饮料收入增加。

食品饮料的毛利率非常高,以AMC为例,其该业务毛利率通常为85%左右,而其电影票售卖的毛利率则不及50%2019Q2 AMC来自食品饮料收入为4.92亿美元,同比增长10%。单用户食品饮料消费额为5.07美元,去年同期为4.89美元。

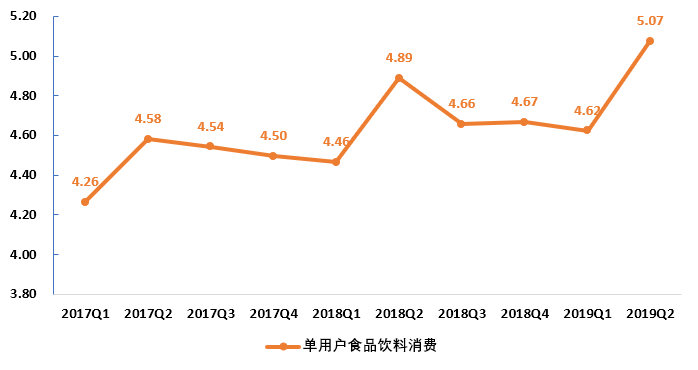
图:2017Q1~2019Q2 AMC单用户食品与饮料消费额(美元)

2019Q2 AMC实现净利润0.49亿美元,同比增长122.5%,这是近四个季度首个盈利季度。

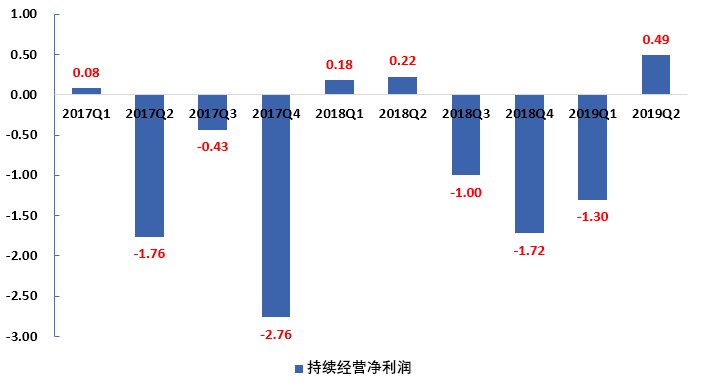
图:2017Q1~2019Q2 AMC持续经营净利润(亿美元)

AMC实现盈利的关键是控制资本开支,资本开支包括维持性资本开支与增长性资本开支。2017~2018年,AMC资本开支分别达6.27亿与5.76亿美元,大部分资金用于剧院改造、收购、新建、升级影院、服务模式和技术。

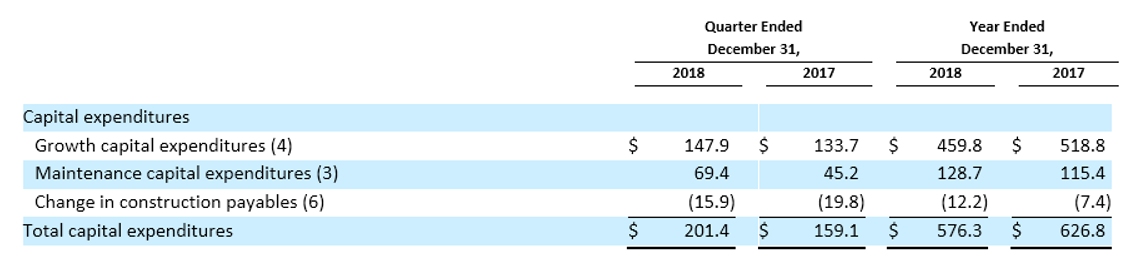
公司降低了2019年资本开支的预测,预计2019年资本开支为4.15亿美元,比之前预测值低3500万美元,相比2018年显著下降,预计2020年资本开支下降为3亿美元。

我们认为,面对流媒体等多种娱乐形式冲击,AMC推出订阅服务,可以一定程度把观众留在电影院,但吸引观众走进电影院的关键还是优质的电影供给。对AMC而言,成本控制是助其走出亏损困境的关键。20167月,AMC并购欧洲最大院线Odeon后,20172018年大幅增长,可以看做双方的整合成本。预计随着整合完成,AMC资本开支将逐年下降,盈利出现空间。

在收购Odeon之前,AMCPB约为1.7倍左右,PE30倍左右。收购之后由于并表加上资本开支增加等因素导致AMC出现亏损,PB也下降到1倍左右。我们认为,AMC目前处于低估值区间,有着较强的安全边际,随着业绩扭亏,有望回到之前的估值区间。

Follow us
Find us on Facebook, Twitter , Instagram, and YouTube or frequent updates on all things investing.Have a financial topic you would like to discuss? Head over to the uSMART Community to share your thoughts and insights about the market! Click the picture below to download and explore uSMART app!
Disclaimers
uSmart Securities Limited (“uSmart”) is based on its internal research and public third party information in preparation of this article. Although uSmart uses its best endeavours to ensure the content of this article is accurate, uSmart does not guarantee the accuracy, timeliness or completeness of the information of this article and is not responsible for any views/opinions/comments in this article. Opinions, forecasts and estimations reflect uSmart’s assessment as of the date of this article and are subject to change. uSmart has no obligation to notify you or anyone of any such changes. You must make independent analysis and judgment on any matters involved in this article. uSmart and any directors, officers, employees or agents of uSmart will not be liable for any loss or damage suffered by any person in reliance on any representation or omission in the content of this article. The content of this article is for reference only. It does not constitute an offer, solicitation, recommendation, opinion or guarantee of any securities, financial products or instruments.The content of the article is for reference only and does not constitute any offer, solicitation, recommendation, opinion or guarantee of any securities, virtual assets, financial products or instruments. Regulatory authorities may restrict the trading of virtual asset-related ETFs to only investors who meet specified requirements.
Investment involves risks and the value and income from securities may rise or fall. Past performance is not indicative of future performance.
uSMART
Wealth Growth Made Easy
Open Account